


Safety KPI Software
Track and visualise your safety performance in real time. Falcony helps consolidate safety KPIs and drive accountability across teams.
300,000+ Users all over the globe


Results You Can Expect
63%
Faster monthly safety reporting
68%
More transparency on safety trends
55%
Greater alignment of safety actions to performance

Frequent Safety KPI Tracking Challenges
Without clear metrics, it’s hard to know if safety is improving or regressing.

KPIs Are Manually Compiled
Safety teams spend hours on spreadsheets to generate reports.

No Real-Time Visibility
Executives and frontline managers don’t see live KPI trends.

Disconnected From Actions
KPIs don’t link back to observations, incidents or corrective actions.

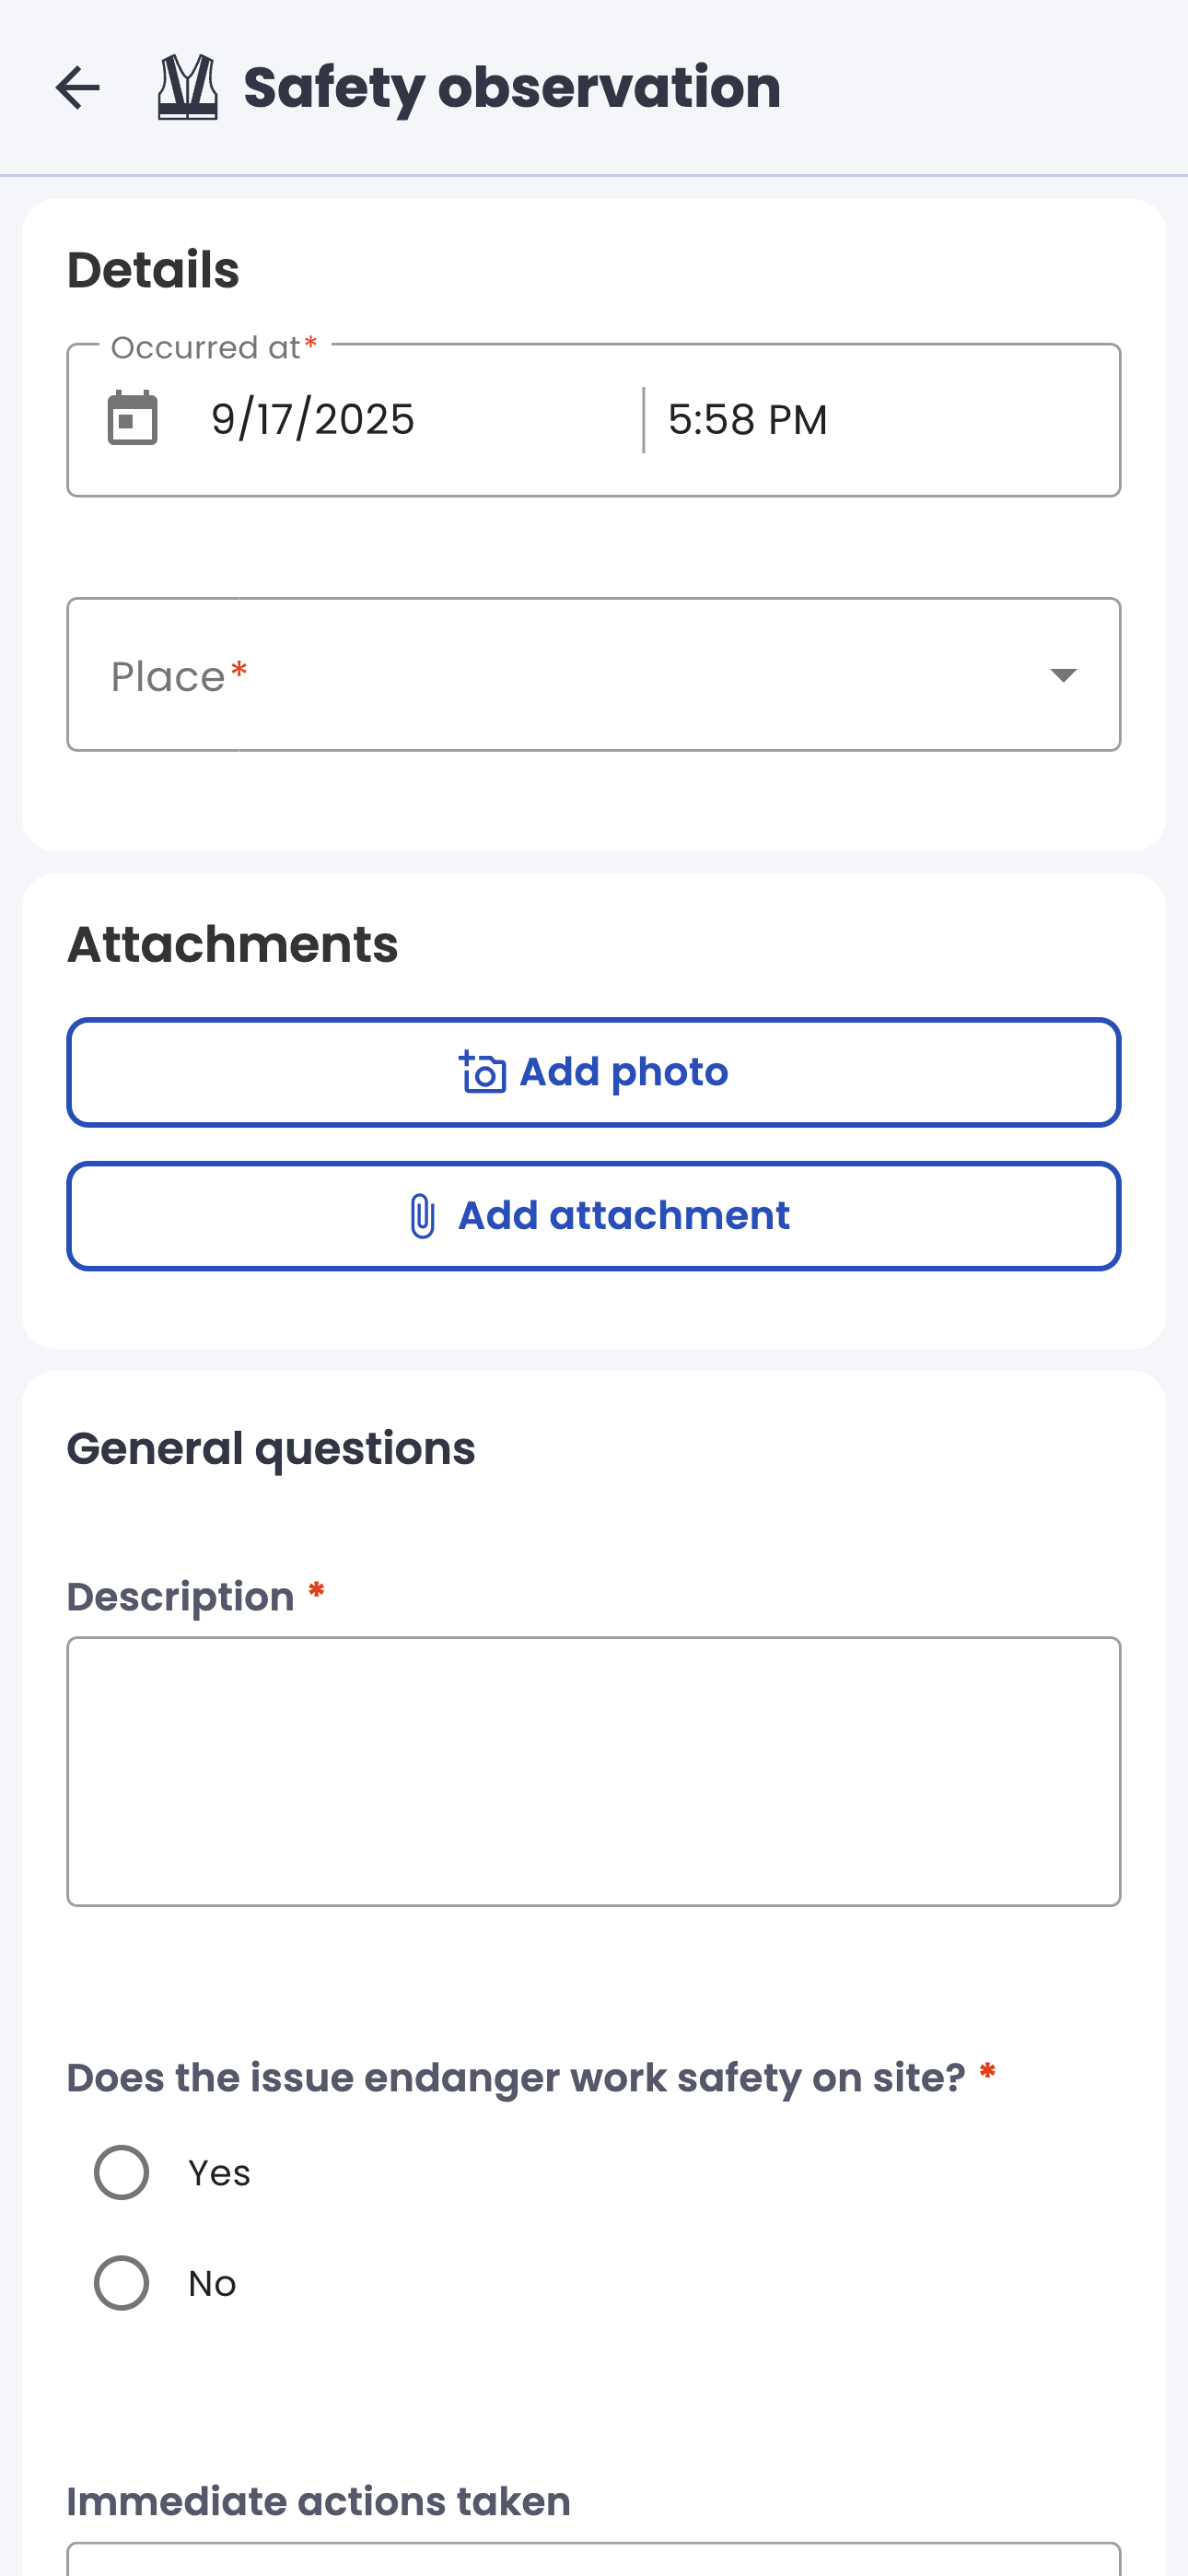
Pre-Built Safety KPI Templates
Track LTIFR, TRIF, near misses and safety observations.

Live Dashboards and Trend Charts
Visualise performance by team, location or time period.

KPI Drill-Down and Benchmarking
See what’s driving changes and compare across units.

Link KPIs to Source Data and Actions
Go from metric to root cause and follow-up with a click.

How Falcony Powers Safety KPI Monitoring
Falcony connects your safety data sources to visual dashboards and metrics.


